
The global corporate landscape is currently witnessing a fundamental shift in how human capital development is measured and optimized, moving away from traditional "check-the-box" compliance toward a sophisticated, data-driven model of performance engineering. For years, the Learning and Development (L&D) sector has treated data capability as a binary state—an organization either possesses data or it does not—but industry experts now recognize that data proficiency exists on a complex maturity curve. This evolution is not merely a matter of upgrading software; it represents a total transformation in organizational mindset, technical infrastructure, and the relationship between educational initiatives and business outcomes.
The Historical Context of Learning Analytics
To understand the current state of L&D data maturity, one must look at the chronology of learning technology. In the early 2000s, the rise of the Learning Management System (LMS) introduced the first wave of digital tracking, primarily focused on SCORM (Sharable Content Object Reference Model) standards. This era was defined by "completion tracking," where success was measured by the number of employees who finished a module. By the mid-2010s, the introduction of xAPI (Experience API) and Learning Record Stores (LRS) began to allow for the tracking of learning experiences outside the traditional LMS, such as social learning and on-the-job performance.
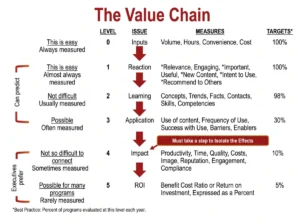
Despite these technological advancements, many L&D functions remain tethered to legacy mindsets. According to recent industry surveys, while over 80% of L&D leaders acknowledge the importance of data, fewer than 20% feel they can effectively demonstrate the return on investment (ROI) of their programs to senior leadership. This gap between intent and execution defines the first major hurdle on the maturity curve.
Stage One: The Era of Static Reporting and Vanity Metrics
The baseline of the maturity curve is Stage One: Static Reporting. In this phase, data is treated as a historical record rather than a strategic asset. Most information remains "locked" within the LMS or fragmented across various disconnected spreadsheets. The primary output of this stage consists of prebuilt reports—often configured months or years prior—that answer basic questions about activity rather than impact.
At this level, L&D departments focus on what are frequently termed "vanity metrics." These include completion rates, total hours of training delivered, and average scores on post-course assessments. While these figures are necessary for regulatory compliance and basic program monitoring, they are fundamentally backward-looking. A high completion rate provides no insight into whether a behavior has changed on the factory floor or if a sales representative has actually improved their closing techniques. The limitation here is a significant bottleneck: every new question requires a manual export of data, often leading to "data silos" where information is inconsistent and difficult to verify across different departments.
Stage Two: The Transition to Integrated Business Intelligence
The move to Stage Two, Business Intelligence (BI), marks the first significant leap in maturity. This transition is characterized by a shift from "what happened" to "why it happened and what it means." Business Intelligence in L&D involves the integration of learning data with broader corporate data sets, such as performance reviews, sales figures, and employee engagement scores.
Technically, this stage requires a more robust infrastructure, often involving data lakes or specialized analytics tools that can ingest data from multiple sources. The goal is to identify correlations. For instance, an organization at Stage Two can determine if employees who completed a specific leadership tract have lower turnover rates in their teams compared to those who did not.
However, this stage is often where initiatives stall. The work of "data cleaning"—resolving inconsistent employee IDs, aligning date formats, and ensuring data integrity across disparate platforms—is unglamorous and resource-intensive. Industry analysts note that L&D functions often underestimate the technical debt associated with legacy systems, which can make genuine BI integration a multi-year project rather than a quick software implementation.
Stage Three: Democratized Access and the Removal of Gatekeepers
Once an organization has established a reliable data foundation, the focus shifts to Stage Three: Democratized Self-Service Access. At this point, the value of data is no longer restricted to a small team of analysts or power users. Instead, the capability to generate insights is pushed out to program managers, regional leads, and even business unit stakeholders.
The core objective of democratization is the elimination of the "insight delay." In Stages One and Two, a manager might wait weeks for a data analyst to provide a report on skill gaps. By the time the report arrives, the business need may have shifted. In Stage Three, intuitive dashboards and self-service interfaces allow stakeholders to filter, pivot, and explore data in real-time.
This stage requires a significant cultural shift. It necessitates a higher level of "data literacy" among non-technical staff. Organizations at this level often invest in internal training to ensure that managers not only know how to access the data but also how to interpret it without falling into common statistical traps, such as confusing correlation with causation.
Stage Four: The Frontier of Conversational and Natural-Language Analytics
The most advanced stage of the maturity curve is Stage Four: Conversational Access. This phase leverages Generative Artificial Intelligence (AI) and Natural Language Processing (NLP) to remove the final barrier to data utilization: the user interface. Rather than navigating complex dashboards or building queries, users can simply ask questions in plain English, such as, "Which departments in the EMEA region are showing the highest proficiency in our new cybersecurity protocols?"
This stage represents the ultimate "pull" model of data. It allows executives and frontline managers to get immediate answers during the flow of work. However, Stage Four introduces new risks. AI models are only as reliable as the data they are trained on. A conversational tool that provides a confident but inaccurate answer based on "dirty data" or poor integration is more dangerous than a spreadsheet that clearly shows its own limitations. Furthermore, this stage requires the highest level of technical sophistication to ensure that the AI respects data privacy and does not "hallucinate" trends that do not exist.
The Critical Role of Governance Across the Curve
A common mistake in L&D data strategy is treating data governance as a final step or a technical afterthought. In reality, governance must be the "undercurrent" that supports every stage of the curve. Governance encompasses the policies, roles, and standards that ensure data is used accurately, ethically, and securely.
- Stage One Governance: Focuses on basic data entry standards and ensuring that "completion" means the same thing across different modules.
- Stage Two Governance: Addresses the complexities of data integration, ensuring that when LMS data meets HRIS (Human Resources Information System) data, the privacy of the employee is maintained.
- Stage Three Governance: Becomes essential as more people gain access. It defines who can see what—ensuring, for example, that a manager cannot see the granular, private assessment scores of an employee in another department.
- Stage Four Governance: Focuses on AI ethics and the validation of machine-generated insights.
Without a robust governance framework, the push for higher maturity can lead to "data anarchy," where different departments report conflicting versions of the truth, leading to a loss of credibility for the L&D function.
Industry Reactions and Expert Analysis
Market analysts from firms like Gartner and Deloitte have noted that the "S-curve" of L&D data adoption is accelerating. The sudden availability of large language models (LLMs) has created a sense of urgency among Chief Learning Officers (CLOs). Many are feeling pressure from the C-suite to implement AI-driven analytics before they have even mastered Stage Two integration.
"The temptation to leapfrog from Stage One straight to Stage Four is immense," says one industry consultant. "But you cannot have a meaningful conversation with your data if your data is still living in a dozen different basements. If the foundation is broken, the AI will just help you make wrong decisions faster."
The consensus among digital transformation experts is that the most successful organizations are those that treat the maturity curve as a journey of incremental builds. They prioritize "clean" data over "fancy" tools and invest heavily in the middle layers of the curve—integration and democratization—before chasing the allure of fully conversational AI.
Broader Implications for the Future of Work
The movement up the L&D data maturity curve has profound implications for the broader organization. As L&D becomes more data-mature, it shifts from being a cost center to a value creator.
- Predictive Talent Management: High-maturity organizations can use learning data to predict future performance gaps before they impact the bottom line.
- Agile Reskilling: With real-time insights, companies can pivot their training efforts in weeks rather than months to meet changing market demands.
- Personalized Career Pathing: Data allows for a "segment of one" approach, where learning is tailored to an individual’s specific skill gaps and career aspirations, significantly improving retention.
Ultimately, the L&D data maturity curve is about more than just numbers; it is about the ability of an organization to understand its own human potential. As functions move from the backward-looking reports of Stage One to the intuitive, AI-driven insights of Stage Four, the role of the L&D professional evolves from an administrator of content to a strategic architect of organizational capability. The journey is difficult and requires a commitment to the "unglamorous" work of data management, but for those who reach the upper echelons of the curve, the rewards include a seat at the executive table and a clear, measurable impact on the success of the business.