
As global enterprises navigate an increasingly volatile economic landscape, the focus on human capital efficiency has intensified, placing the Return on Investment (ROI) of corporate training at the center of executive discourse. The corporate learning market is currently on a trajectory to exceed $100 billion by 2032, according to recent data from MarketsandMarkets. However, despite this massive financial commitment, a significant disconnect persists between spending and accountability. McKinsey’s 2025 Global L&D Survey reveals a startling statistic: only 8% of organizations currently measure the business impact of their learning programs. This gap highlights a critical vulnerability for Chief Human Resources Officers (CHROs) and Learning and Development (L&D) leaders who must justify multi-million dollar budgets in an era of fiscal scrutiny.
The ROI of corporate learning is a metric designed to quantify the financial value generated by training programs relative to their total cost. The standard mathematical expression is calculated as the benefits of training minus the cost of training, divided by the cost of training, and then multiplied by 100 to reach a percentage. While the arithmetic is straightforward, the complexity lies in isolating the variables. For most organizations, the challenge is not the math, but the methodology of data collection and the integration of disparate software systems.
The Evolution of Training Evaluation: A Chronological Perspective
The methodology for measuring training effectiveness has undergone several transformations over the last seven decades. Understanding this evolution is essential for modern organizations looking to implement a Level 5 ROI framework.
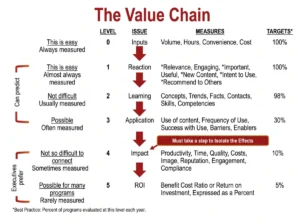
In 1954, Donald Kirkpatrick introduced his Four-Level Training Evaluation Model, which focused on Reaction, Learning, Behavior, and Results. For decades, this served as the gold standard. However, by the late 1990s and early 2000s, as corporate budgets grew, stakeholders began demanding a fifth level: financial ROI. This addition, popularized by Jack Phillips, shifted the focus from "did the employees learn?" to "did the company profit?"
By the 2010s, the rise of the Learning Management System (LMS) allowed for better tracking of "vanity metrics," such as completion rates and test scores. Yet, these metrics remained siloed from actual performance data. Entering 2025, the industry is seeing the rise of AI-native employee experience platforms that unify learning, performance reviews, and business Key Performance Indicators (KPIs) into a single ecosystem. This technological shift is finally allowing organizations to bridge the gap between Level 2 (Learning) and Level 5 (ROI).
Why Traditional ROI Measurement Frequently Fails
The discrepancy between the perceived importance of ROI and its actual measurement is attributed to several systemic hurdles. Most organizations fall into the trap of measuring what is easy rather than what is meaningful.
- Data Silos: In many corporate environments, learning data resides in an LMS, while performance data is stored in an HRIS (Human Resources Information System), and financial data is held in an ERP (Enterprise Resource Planning) system. Without integration, correlating a specific training module with a spike in sales or a decrease in operational errors is nearly impossible.
- Lack of Baselines: Measurement requires a point of comparison. Many L&D teams launch programs without first establishing a pre-training performance baseline. Without knowing where employees started, it is impossible to quantify how far they have progressed.
- The Isolation Challenge: External factors—such as market shifts, new product launches, or seasonal trends—often influence performance. Isolating the specific contribution of a training program from these external variables requires sophisticated statistical analysis that many L&D departments are not equipped to perform.
- Short-term Focus: ROI in education often manifests over months or years, whereas corporate reporting cycles are quarterly. This temporal misalignment often leads to the premature cancellation of programs that might have yielded high long-term returns.
The Kirkpatrick + ROI Framework: A Multi-Tiered Approach
To move beyond simple completion rates, industry experts recommend an integrated framework that builds upon the Kirkpatrick model by adding a final financial layer.

- Level 1: Reaction. This measures participant satisfaction. While often dismissed as "smiley sheets," this data is crucial for identifying if the delivery method is engaging or if the content is relevant to the user’s daily tasks.
- Level 2: Learning. This assesses the increase in knowledge or skills. Pre- and post-tests are the standard here. In 2025, AI-driven assessments are increasingly used to measure not just rote memorization but the application of logic.
- Level 3: Behavior. This level tracks on-the-job behavior change. Are employees actually using the new software? Are managers using the feedback techniques they were taught? This is typically measured through 360-degree reviews and manager observations.
- Level 4: Business Results. This is where the training connects to KPIs. Examples include reduced turnover rates, increased units produced per hour, or a reduction in safety incidents.
- Level 5: ROI. This converts Level 4 results into a monetary value and compares it against the total program cost, including hidden costs like employee downtime and infrastructure.
Industry Benchmarks and Performance Standards
Data from recent industry reports suggest that ROI varies significantly depending on the nature of the training. Organizations can use these benchmarks to set realistic expectations for their programs:
- Sales Training: Historically the easiest to measure, sales training often delivers an ROI between 100% and 350%. Because the "benefit" (increased revenue) is already in a currency format, the correlation is direct.
- Onboarding Programs: Effective onboarding is linked to higher retention. Benchmarks suggest an ROI of 100% to 200%, primarily driven by the reduction in "time-to-productivity" for new hires and lower recruitment costs due to decreased early-stage attrition.
- Technical and Soft Skills Training: Programs focused on specific technical competencies or leadership development typically see an ROI of 150% to 300%. These returns are often realized through improved operational efficiency and the internal promotion of talent, which is significantly cheaper than external hiring.
The Role of Integrated Technology and AI
The primary catalyst for the recent shift in ROI measurement is the emergence of integrated learning and productivity platforms. Modern systems, such as those developed by AI-native providers like Lyearn, are designed to unify the employee experience. By connecting learning data directly to OKRs (Objectives and Key Results) and performance reviews, these platforms eliminate the "isolation challenge."
For instance, an AI-native platform can track a salesperson’s progress through a "Negotiation Skills" course and automatically correlate their completion of that course with their subsequent "Close Rate" in the CRM. This real-time data flow allows L&D leaders to see exactly which programs are driving revenue and which are underperforming, allowing for agile adjustments to the curriculum.
Furthermore, AI is now being used for "Predictive ROI." By analyzing historical data, these systems can predict the likely financial impact of a training program before it is even rolled out, allowing executives to allocate budgets to the initiatives with the highest potential impact.
Broader Implications for the Future Workforce
The move toward rigorous ROI measurement in corporate eLearning has profound implications for the global workforce. As companies become more precise in their measurement, the "skills-first" economy will accelerate. We are likely to see a shift away from generalized training toward highly personalized, "just-in-time" learning modules that address specific performance gaps identified by AI.
From a strategic standpoint, the ability to prove ROI transforms the L&D department from a "cost center"—a department that consumes budget—into a "profit center"—a department that generates measurable value. This shift is essential for the long-term sustainability of corporate education. When L&D can prove that a $1 million investment in training yielded a $3 million increase in operational efficiency, the conversation with the CFO changes from "how much can we cut?" to "how much more can we invest?"
In conclusion, while the McKinsey 2025 data suggests that the majority of organizations are still struggling with impact measurement, the tools and frameworks to bridge this gap are now available. The transition to a Level 5 ROI model is no longer a luxury for the most advanced firms; it is becoming a requirement for any organization that views its workforce as a strategic asset. By moving beyond vanity metrics and embracing integrated, data-driven platforms, companies can ensure that their multi-billion dollar investments in eLearning translate into tangible, bottom-line growth.