
The modern enterprise landscape has witnessed a seismic shift in how software and service providers interact with their clientele, moving away from transactional sales toward a model centered on long-term value realization. At the heart of this transformation lies customer education—a discipline that has evolved from a secondary support function into a primary driver of business growth and retention. However, as organizations invest billions into sophisticated Learning Management Systems (LMS) and instructional design, a critical gap has emerged between the metrics being tracked and the actual value being generated. While traditional success metrics have long prioritized course completion rates and certificate issuance, industry analysts and customer success leaders are now advocating for a more nuanced, multi-dimensional approach to measurement. The consensus among market experts is that a student may navigate every module of a training program and still fail to apply the product effectively within their specific professional context. To bridge this gap, forward-thinking organizations are recalibrating their analytics to focus on product adoption, psychological confidence, support ticket trends, and tangible real-world performance.
The Evolution of Customer Education: A Chronological Perspective
To understand the current shift in measurement strategies, it is essential to trace the history of how businesses have historically taught their customers. In the early era of enterprise software, customer education was largely reactive and manual. During the 1990s and early 2000s, training often consisted of thick printed manuals or expensive, multi-day on-site workshops led by consultants. Success was measured simply by attendance or the physical distribution of materials.
By the mid-2010s, the rise of Software-as-a-Service (SaaS) necessitated a more scalable approach. This period saw the proliferation of digital learning platforms and "on-demand" webinars. During this phase, "completion rates" became the gold standard. If a user reached the final slide of a digital presentation, the training was deemed successful. This era prioritized the volume of content consumed over the quality of knowledge retained.
Entering the 2020s, the "Product-Led Growth" (PLG) movement changed the stakes once again. With lower switching costs and a hyper-competitive market, companies realized that simply "finishing a course" did not prevent churn. The current era, often referred to as the "Outcome-Based Era," demands that education teams prove a direct correlation between learning and the customer’s bottom line. This chronology highlights a transition from participation-based metrics to behavior-based insights.
The Limitation of Vanity Metrics in Educational Environments
The reliance on completion rates as a primary Key Performance Indicator (KPI) is increasingly viewed as a "vanity metric" by strategic leaders. While high completion numbers might look impressive in a quarterly board report, they often mask underlying inefficiencies in the curriculum. For instance, a high completion rate might indicate that a course is too easy or that users are simply clicking through to satisfy a corporate mandate. Conversely, a high drop-off rate might not signify failure; it could mean that a user found the specific answer they needed in the second module and immediately returned to the product to apply it.
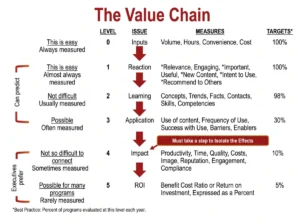
Furthermore, completion does not equate to comprehension. Market data suggests that "passive consumption" of video content has a low retention rate compared to active, project-based learning. When organizations focus solely on the "finish line," they ignore the "application phase," which is where the true return on investment (ROI) resides. This realization has prompted a shift toward measuring what happens after the learner logs out of the training portal.
Deepening Product Adoption Through Strategic Education
One of the most reliable indicators of educational success is a measurable change in product adoption patterns. Advanced analytics now allow companies to track "feature depth"—the extent to which a customer uses the more complex, high-value components of a product rather than just the basic functionality.
When training is effective, there is a visible "adoption curve" where users migrate from "core features" to "power features." For example, a customer using a project management tool might initially only use it for task lists. Following a successful advanced training module, data should show an uptick in their use of automated workflows, API integrations, and data visualization dashboards. By comparing the behavior of "trained" versus "untrained" user cohorts, companies can calculate an "Education Impact Score." Statistical evidence consistently shows that users who engage with educational content are 25% to 40% more likely to adopt new feature releases, thereby increasing the "stickiness" of the product within their organization.
Quantifying Customer Confidence and Psychological Readiness
While data points like clicks and logins are objective, the psychological state of the user is equally vital. Customer confidence is a leading indicator of long-term retention. A confident user is more likely to troubleshoot their own problems, advocate for the product internally, and explore new use cases without fear of "breaking" the system.
To measure this, sophisticated organizations are moving beyond the standard Net Promoter Score (NPS) and implementing "Confidence Surveys" immediately following training sessions and again 30 days later. These surveys ask specific questions regarding the user’s comfort level in performing complex tasks independently. According to recent studies on customer experience, confident customers are five times more likely to recommend a product to a peer. This qualitative data, when aggregated, provides a "Sentiment Map" that can highlight which parts of the product are perceived as intuitive and which require further educational intervention.
Analyzing Support Ticket Trends and Operational Efficiency
A primary goal of customer education is to reduce the burden on technical support teams. By analyzing the volume and nature of support tickets before and after the implementation of a training program, companies can measure "Ticket Deflection."
Success in this area is not just about a total reduction in tickets, but a shift in the type of queries being received. If a training program is successful, the frequency of "how-to" or "Tier 1" questions should decrease significantly. This allows support engineers to focus on high-level technical issues and system-wide optimizations rather than repetitive instructional tasks. From a financial perspective, the cost of a single support interaction can range from $15 to over $100 depending on the complexity. By deflecting thousands of basic queries through effective self-service education, a company can save millions in annual operational costs.
Linking Education to Net Revenue Retention (NRR)
In the subscription economy, Net Revenue Retention (NRR) is the ultimate metric of health. It measures the ability of a company to retain and grow its revenue from existing customers. There is a direct, documented link between customer education and NRR.
Trained customers are less likely to "churn" because they have integrated the product into their daily workflows. Furthermore, they are more likely to be candidates for "expansion" or "upselling." When a customer understands the full scope of what a platform can do, they are more inclined to purchase additional licenses or upgrade to a higher-tier plan. Industry benchmarks indicate that accounts with "certified" users have a renewal rate that is 10% to 15% higher than accounts without them. This makes customer education a critical component of the revenue engine, rather than just a cost center.
Performance-Based Assessment and Real-World Application
The most rigorous way to measure training success is through performance-based assessments. Rather than a multiple-choice quiz, this involves observing whether the user can complete a specific business objective using the tool. This could include setting up a live marketing campaign, generating a complex financial report, or configuring a secure cloud environment.
Some companies are now utilizing "sandbox" environments where users must perform tasks in a simulated version of the software to earn their certification. This ensures that the knowledge has transitioned from short-term memory to functional skill. By tracking the "time-to-first-value"—how quickly a new user reaches a major milestone after training—companies can objectively prove the efficiency of their onboarding programs.
The Role of Continuous Feedback Loops
The market and the technology it uses are in a state of constant flux. Therefore, a measurement strategy cannot be static. Continuous feedback loops, gathered through community forums, user interviews, and "in-app" feedback widgets, allow education teams to iterate on their content in real-time.
If a particular module consistently receives low confidence scores or is followed by a spike in support tickets, it serves as an early warning system that the content is either outdated or confusing. This agile approach to curriculum development ensures that the educational resources remain aligned with the current version of the product and the evolving needs of the user base.
Industry Perspectives and Expert Analysis
Chief Customer Officers (CCOs) across the tech sector are increasingly vocal about the need for "Education-Led Growth." Many argue that in an era where software features are easily replicated by competitors, the "educational experience" becomes a key differentiator.
"The product is the ‘what,’ but education is the ‘how,’" notes one industry analyst. "If your customers don’t know how to achieve their goals with your tool, the tool itself is worthless to them." This sentiment is echoed in recent white papers from major consulting firms, which suggest that companies that invest in "comprehensive customer success ecosystems"—which include robust education, community, and support—see a significantly higher valuation than those that focus solely on sales and marketing.
Conclusion: Building a Balanced Scorecard for the Future
The transition toward a more sophisticated measurement of customer training represents a maturing of the B2B relationship. By moving beyond the simplicity of completion rates, organizations can gain a holistic view of how their educational initiatives contribute to the health of the business and the success of the customer.
A balanced measurement strategy integrates diverse data points: the hard numbers of product adoption and retention, the operational data of support ticket trends, the psychological insights of customer confidence, and the practical evidence of real-world performance. This multi-faceted approach does more than just justify the budget for training departments; it provides a roadmap for building deeper, more resilient partnerships with clients. Ultimately, the goal of customer education is to transform a "user" into an "expert," and in doing so, ensure that both the customer and the provider grow together in a rapidly changing digital economy.