The Strategic Shift in Learning and Development
For decades, the success of a training program was measured by "butts in seats" or the simple completion of digital modules. However, as the global economy faces inflationary pressures and rapid technological disruption, the role of the Chief Learning Officer (CLO) has evolved from a facilitator of content to a driver of business performance. The release of the 21 L&D metrics checklist marks a pivotal moment for the industry, offering a structured approach to what has historically been a fragmented process: the quantification of human capital growth.
According to recent industry reports, global spending on corporate training has surpassed $370 billion. Despite this massive investment, a significant portion of executives remain skeptical of the actual return on investment (ROI). Research from LinkedIn Learning indicates that while 83% of L&D pros want to be more data-driven, many struggle with knowing which data points actually resonate with business leaders. The 360Learning checklist addresses this specific pain point by categorizing metrics into a logical progression, from foundational participation to advanced workforce transformation.
A Chronology of Measuring Learning Impact
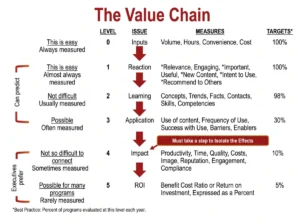
To understand the importance of this new checklist, one must look at the evolution of learning analytics. In the mid-20th century, the Kirkpatrick Model established four levels of evaluation: Reaction, Learning, Behavior, and Results. While this model remains a staple, the digital age has introduced layers of complexity that require more granular data.
In the early 2000s, the rise of Learning Management Systems (LMS) allowed for the tracking of "vanity metrics"—logins, time spent on page, and quiz scores. By the 2010s, the focus shifted toward "Learning Experience," where engagement became the primary KPI. Today, in the mid-2020s, the focus has moved toward "Performance Infrastructure." The current era demands that L&D teams prove how training reduces "Time to Proficiency" for new hires or how it directly impacts "Customer Satisfaction (CSAT)" scores. The 360Learning guide arrives as the latest iteration in this timeline, offering a modernized framework that incorporates collaborative learning and peer-to-peer knowledge sharing into the ROI equation.
Foundational and Advanced Metrics: A Dual Approach
The checklist is structured to guide L&D leaders through various stages of maturity. At the foundational level, the guide emphasizes the importance of tracking engagement depth rather than just breadth. This includes measuring the "Active Learner Rate" and "Content Freshness," ensuring that the materials provided are not only being used but are also relevant to the current business climate.
As organizations move up the maturity curve, the checklist introduces more sophisticated indicators. These include:
![Checklist: 21 L&D Metrics That Prove Training Impact And ROI [eBook Launch]](https://cdn.elearningindustry.com/wp-content/uploads/2026/05/Checklist_-21-LD-Metrics-That-Prove-Training-Impact-And-ROI.jpg)
Skills Gap Closure Rates
One of the most critical metrics in the modern workforce is the ability to identify and fill specific skill deficiencies. With the World Economic Forum predicting that 44% of workers’ skills will be disrupted by 2027, the ability to measure "Skill Acquisition Velocity" is becoming a competitive necessity. The checklist provides methods for quantifying how quickly an employee moves from a "novice" to an "expert" level following a specific intervention.
Impact on Employee Retention
There is a direct correlation between robust training programs and employee longevity. Data suggests that employees who feel they have opportunities to learn are 2.9 times more likely to be engaged. The 360Learning guide helps L&D teams correlate training participation with "Employee Net Promoter Scores (eNPS)" and turnover rates, providing a clear financial argument for the cost-saving benefits of retention through development.
Revenue and Productivity Linkage
Perhaps the most challenging area of L&D measurement is linking learning to the bottom line. The checklist offers frameworks for measuring "Sales Enablement Impact" and "Operational Efficiency." For instance, by tracking the performance of a sales team before and after a product knowledge certification, L&D can claim a direct percentage of the resulting revenue increase.
Supporting Data and Market Realities
The necessity for such a checklist is underscored by the current "skills gap" crisis. A 2023 McKinsey report found that 87% of companies worldwide are either currently experiencing a skills gap or expect to face one within a few years. Despite this, only a fraction of these companies feel they have the data necessary to address the problem effectively.
Furthermore, the rise of Artificial Intelligence (AI) in the workplace has created a "reskilling emergency." Organizations are now tasked with retraining entire departments on AI tools. In this high-stakes environment, the 360Learning checklist serves as a vital tool for auditing the effectiveness of these emergency upskilling initiatives. By utilizing the 21 metrics, companies can determine if their AI training is actually leading to increased output or if it is merely an academic exercise.
Industry Reactions and Expert Perspectives
While the eBook is a sponsored release by 360Learning, its reception among industry analysts highlights a broader trend toward "Evidence-Based L&D." Market analysts suggest that the move toward standardized metrics is a sign of the professionalization of the department.
"L&D is finally getting its seat at the table, but that seat comes with a price: accountability," says one industry observer. "The 360Learning checklist is essentially a script for that conversation with the CFO. It translates ‘learning’ into ‘business value.’"
![Checklist: 21 L&D Metrics That Prove Training Impact And ROI [eBook Launch]](https://cdn.elearningindustry.com/wp-content/uploads/2026/05/Checklist_-21-LD-Metrics-That-Prove-Training-Impact-And-ROI-768x431.jpg)
Internally, L&D leaders have expressed a need for a "hands-on framework" that simplifies the overwhelming amount of data generated by modern learning platforms. The consensus among early adopters of the checklist is that it helps prioritize which data to report, preventing "analysis paralysis" while ensuring that the narrative presented to stakeholders is both clear and data-driven.
Broader Implications for the Future of Work
The release of this guide has implications beyond the L&D department. It signals a shift toward a more transparent and meritocratic corporate culture. When training impact is measured accurately, organizations can more fairly reward those who seek self-improvement and contribute to the company’s collective intelligence.
Moreover, this data-driven approach facilitates better resource allocation. If the metrics show that a certain type of training—such as long-form video lectures—is not yielding a return, companies can pivot toward more effective methods like "micro-learning" or "collaborative peer-to-peer coaching." This agility is crucial in a volatile market where wasted time and resources can lead to a loss of competitive advantage.
Conclusion: Crafting the Data-Driven Narrative
The "Checklist: 21 L&D Metrics That Prove Training Impact And ROI" is more than just a list of KPIs; it is a call to action for the learning community. It encourages a shift in mindset from seeing training as a cost center to viewing it as a profit-generating engine. By adopting these 21 metrics, L&D leaders can build a compelling narrative that proves the value of their initiatives, secures future budgets, and, most importantly, drives the long-term success of their workforce.
As the corporate world continues to grapple with the challenges of the 21st century, the ability to measure and prove the impact of human development will remain the most significant differentiator between companies that merely survive and those that thrive. The tools provided by 360Learning offer a necessary starting point for this journey toward measurable excellence.