The landscape of private company CEO compensation is undergoing significant shifts, with financial services and biotechnology sectors projected to offer the highest median cash compensation in 2026, according to new data from a comprehensive survey of 1,551 U.S. companies. Conversely, sectors such as retail, education, government, and nonprofit organizations are experiencing downward pressure on executive pay, highlighting a growing divergence in earning potential across industries. This analysis, based on the 2026-2027 survey, provides a detailed look at current trends, historical context, and the underlying factors influencing these compensation disparities.
Sectoral Divide in Executive Compensation
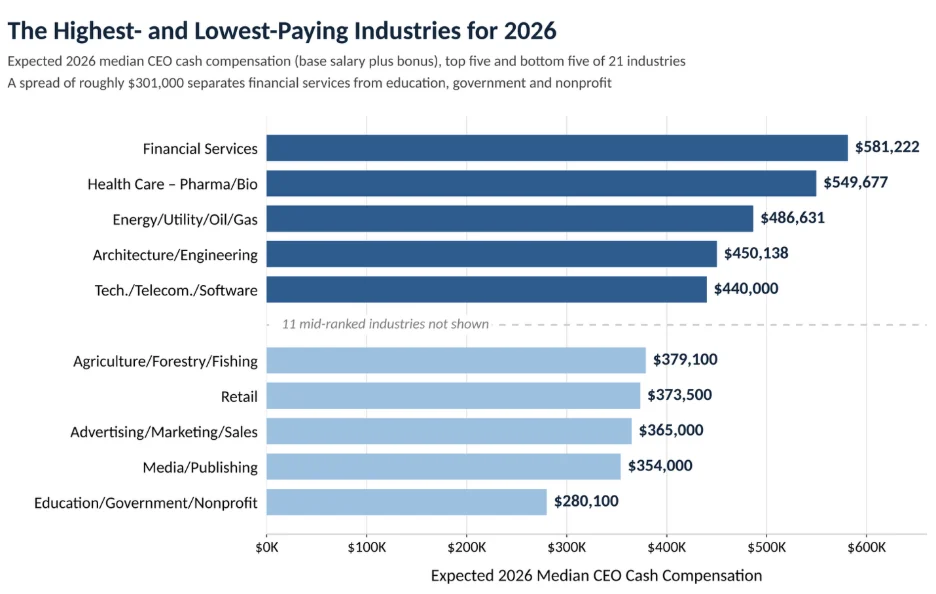
The recent findings underscore a persistent truth in executive compensation: while company size remains a primary determinant of CEO earnings, the industry in which a company operates plays a substantial role. For 2026, financial services CEOs are projected to command the highest median cash compensation, estimated at $581,222. This figure comprises an average base salary of $418,722 and a bonus of $162,500, significantly outpacing the lower end of the spectrum.
Following closely behind, chief executives in the pharmaceutical and biotechnology sectors are expected to earn a median of $549,677. The energy, utilities, oil, and gas industries secure the third position with projected median cash compensation of $486,631. Rounding out the top five highest-paying industries are architecture and engineering ($450,138) and technology, telecommunications, and software ($440,000).
At the opposite end of the spectrum, CEOs in education, government, and nonprofit organizations anticipate the lowest median cash compensation, at $280,100. This group is followed by media and publishing ($354,000), advertising, marketing, and sales ($365,000), retail ($373,500), and agriculture, forestry, and fishing ($379,100). The disparity between the highest and lowest paying sectors is substantial, with a gap of approximately $300,000.
The Nuance of Company Size and Revenue
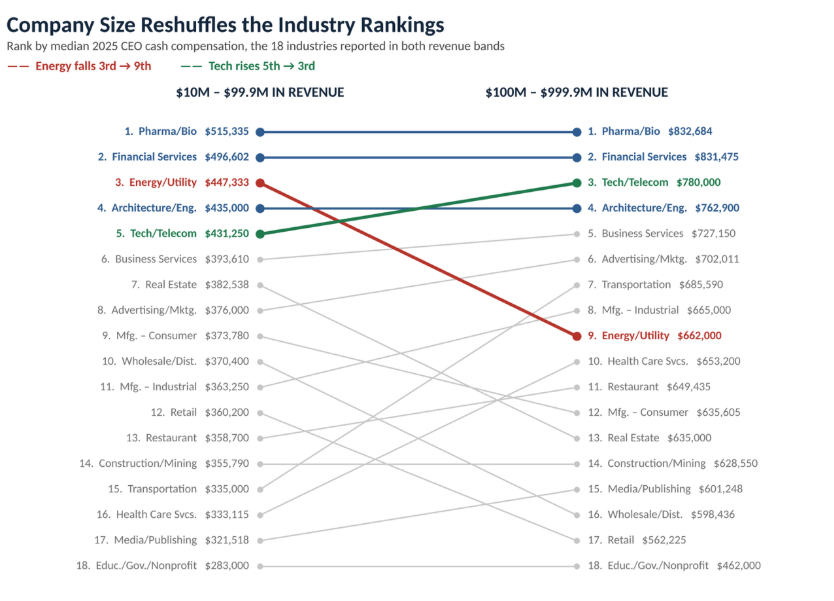
While broad industry rankings offer valuable insights, a deeper examination reveals that company size and revenue significantly influence CEO pay. The survey data highlights that relying solely on industry averages can be misleading. For instance, when analyzing companies with annual revenues between $10 million and $99.9 million, pharmaceutical and biotechnology CEOs earned the highest median cash compensation in 2025, at $515,335. Financial services followed closely at $496,602, with energy at $447,333 and architecture and engineering at $435,000. Technology CEOs in this revenue bracket earned a median of $431,250.
The compensation picture shifts dramatically for larger enterprises. Among companies generating between $100 million and $999.9 million in annual revenue, pharmaceutical/biotech and financial services were virtually tied for the lead, with median CEO cash compensation of $832,684 and $831,475, respectively. In this tier, technology moved up to third place with $780,000, followed by architecture and engineering at $762,900. Notably, the energy sector, which ranked third overall in the 2026 forecast, fell to $662,000 in this revenue band, indicating that the presence of larger firms within a sector can inflate its overall average.
This correlation between revenue size and executive pay suggests that industries with a higher concentration of larger, more profitable companies will naturally report higher average executive compensation. Therefore, for companies benchmarking CEO pay, it is crucial to consider both industry benchmarks and company-specific financial metrics.
Underlying Factors Driving Compensation Differences
The variations in CEO compensation across industries can be attributed to several factors, including how companies generate value, the inherent risks and complexities of their operations, and their financial structures.
-
Financial Services: This sector’s high compensation is often linked to its core functions of capital management, navigating complex regulatory environments, and making critical investment and risk-management decisions. The potential for substantial financial gains and losses necessitates leadership with robust financial acumen and strategic foresight. Financial services also offer the largest median bonuses in dollar terms, reflecting the performance-driven nature of the industry.
-
Pharmaceuticals and Biotechnology: CEOs in this sector face unique challenges, including lengthy and costly product development cycles, scientific uncertainty, rigorous regulatory approval processes, and substantial research and development investments. The high stakes and potential for groundbreaking innovation justify significant compensation for leaders capable of navigating these complex scientific and commercial landscapes.
-
Technology, Telecommunications, and Software: This industry thrives on innovation and rapid adaptation. CEOs are tasked with managing evolving business models, staying ahead of competitive pressures, and fostering environments conducive to groundbreaking technological advancements. The demand for leaders who can effectively navigate this dynamic environment contributes to competitive compensation packages.
-
Energy, Utilities, Oil, and Gas: This sector often involves significant capital investments, fluctuating market prices, and critical infrastructure management. Leaders in this industry are responsible for large-scale operations, long-term resource planning, and often, navigating complex geopolitical and environmental considerations.
-
Education, Government, and Nonprofit Organizations: These sectors operate under distinct financial constraints and governance models. Compensation is often influenced by mission-driven objectives, funding sources (which can be less predictable than commercial revenue), and public or stakeholder scrutiny. These factors typically lead to more conservative compensation structures compared to for-profit enterprises.
-
Retail and Consumer-Facing Businesses: While not at the bottom, these sectors face pressures from high labor costs, volatile demand, and often thinner operating margins. These constraints can limit the resources available for executive incentives, impacting overall compensation levels.
Historical Trends and Sectoral Movements
A look at the past three years (2024-2026) reveals interesting trends and fluctuations in CEO compensation.
-
Financial Services and Biotech Resilience: Both financial services and pharma/biotech have consistently ranked at the top. While financial services saw a dip in projected compensation from $597,500 in 2024 to $540,265 in 2025 before rebounding to $581,222 in 2026, pharma/biotech experienced a more pronounced trajectory, falling from $532,312 in 2024 to $476,517 in 2025, and then surging to $549,677 in 2026. A significant driver of this rebound in biotech appears to be an increase in bonuses, with projected median bonuses rising from $90,000 in 2025 to $150,000 in 2026, while base salaries saw more modest growth. This pattern suggests that executive compensation in these sectors is closely tied to business performance and forward-looking expectations.
-
Energy’s Steady Performance: The energy, utilities, oil, and gas sector has shown remarkable stability in CEO compensation, with figures hovering around $485,000-$491,000 across the three years. While remaining a high-paying sector, its consistent compensation contrasts with the more dynamic movements seen in financial services and biotech.
-
Consistent Low Performers: Education, government, and nonprofit organizations have exhibited striking consistency at the lower end of the pay scale, with projected median cash compensation rising from $275,850 in 2024 to $280,100 in 2026. Similarly, media and publishing have remained near the bottom, with compensation fluctuating slightly but staying in the $350,000-$359,000 range.
-
Retail’s Downward Trend: Among commercial industries, retail stands out for its declining compensation trends. Retail CEOs anticipated median cash compensation of $411,695 in 2024, which slipped to $406,672 in 2025 and is projected to fall further to $373,500 in 2026. This decline is largely driven by a significant reduction in bonuses, which are forecast to drop from $117,632 in 2024 to $75,000 in 2026, while base salaries have remained relatively stable. This trend in variable pay could reflect the increasing importance of financial performance in executive incentive structures within the retail sector.
-
Wholesale and Industrial Manufacturing Recovery: Wholesale and distribution sectors, after experiencing a decline in expected compensation in 2025, are showing signs of recovery, with a projected rebound to $423,338 in 2026. Industrial manufacturing also mirrors this pattern, recovering from a dip in 2025 to reach a projected $412,500 in 2026. Consumer goods manufacturing, meanwhile, has maintained a relatively steady compensation level. These movements may indicate shifting economic conditions, evolving compensation strategies, or changes in the composition of survey respondents.
Implications for Boards and Companies
The data from the 2026-2027 survey offers several key takeaways for corporate boards and compensation committees when reviewing CEO remuneration:
-
Industry is a Critical Factor, But Not the Only One: While industry benchmarks are essential for understanding typical compensation levels, they must be viewed in conjunction with company-specific factors. The inherent profitability, risk profile, and strategic demands of an industry significantly influence pay structures.
-
Company Size and Revenue are Paramount: The stark differences in compensation based on revenue bands underscore the critical role of company scale. Larger companies generally have more resources and face more complex challenges, leading to higher executive pay. Benchmarking must account for these size distinctions.
-
Bonus Structures Reflect Performance Drivers: The fluctuations in bonus payouts, particularly evident in the retail and biotech sectors, highlight how variable pay is used to incentivize and reward performance tied to specific business objectives. Analyzing bonus trends can provide insights into the perceived drivers of success and risk within an industry.
The findings from Chief Executive Group Research’s comprehensive CEO & Senior Executive Compensation Report emphasize that a nuanced approach to compensation benchmarking is crucial. By integrating industry data with an understanding of company size, ownership structure, and financial performance, boards can develop more effective and competitive compensation strategies that align executive rewards with strategic goals and shareholder value. As economic conditions and industry dynamics continue to evolve, ongoing analysis of such data will be vital for ensuring that executive compensation remains both appropriate and competitive.