The landscape of B2B marketing has reached a critical inflection point in 2026, where the divide between data-rich organizations and those relying on legacy intuition has never been wider. As marketing departments face increasing pressure to justify budgets and demonstrate direct contributions to the bottom line, the reliance on accurate, contextualized benchmarks has become a fundamental requirement for survival. According to the 2026 State of Marketing Report by HubSpot, 79% of marketing professionals now acknowledge that their organizations must adopt a more sophisticated data-driven approach to remain competitive in an increasingly crowded digital marketplace. This shift underscores a broader industry movement away from vanity metrics toward high-fidelity pipeline data that reflects the true complexity of the modern B2B buyer’s journey.
The fundamental challenge for marketing leaders in 2026 is not a lack of data, but a lack of context. Metrics such as a $150 cost per lead (CPL) or a 15% Marketing Qualified Lead (MQL) to Sales Qualified Lead (SQL) conversion rate are essentially meaningless in a vacuum. Without considering variables such as channel intent, deal size, sales cycle duration, and specific qualification criteria, these numbers can lead to strategic misalignments. For instance, an enterprise software company with a six-figure average contract value (ACV) would view a $300 CPL as highly efficient, whereas a self-service SaaS provider would find the same figure catastrophic. Consequently, the primary objective of benchmarking in the current era is to provide a reference point for evaluating funnel efficiency and identifying specific stages where prospects are dropping out of the process.
The Evolution of the B2B Marketing Funnel
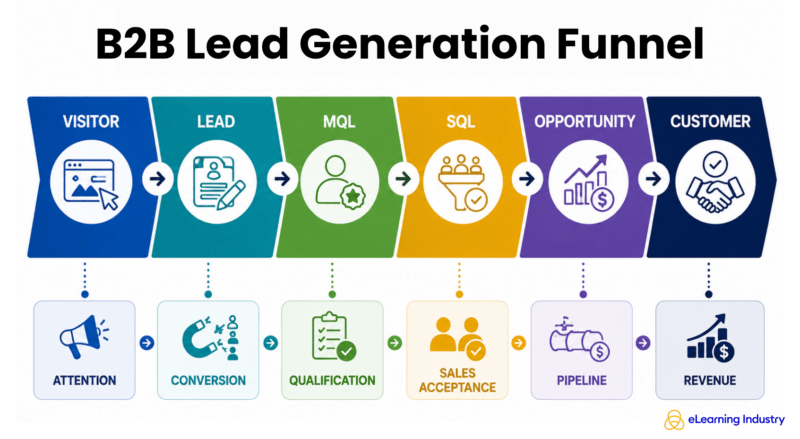
To accurately measure performance, organizations must first establish a standardized definition of their funnel stages. The traditional linear path—Visitor to Lead, Lead to MQL, MQL to SQL, SQL to Opportunity, and finally to Customer—remains the standard framework, but the definitions of these stages have become more rigorous. In 2026, the distinction between a "Lead" and an "MQL" often hinges on sophisticated scoring models that include firmographic data, behavioral signals, and intent data.
Industry analysts observe that internal definitions can radically skew reported conversion rates. For example, a company that classifies every eBook download as an MQL will naturally report a high volume of leads but a dismal MQL-to-SQL conversion rate. Conversely, an organization that requires an MQL to match a specific Ideal Customer Profile (ICP) and demonstrate high-intent behavior (such as visiting a pricing page multiple times) will report lower lead volumes but significantly higher conversion rates downstream. This variance highlights why "average" industry benchmarks should be used as a guide rather than a rigid target.
Key Conversion Benchmarks for 2026
Current market analysis across 14 major industries and nearly 30,000 leads suggests that conversion rates are stabilizing after the volatility of the mid-2020s. For visitor-to-lead conversion, most B2B websites are currently performing within a 1% to 5% range. Data indicates a median conversion rate of 2.4%, with top-quartile performers exceeding 5%. These figures are heavily influenced by the nature of the "ask"; a low-friction offer like a checklist or newsletter subscription will convert at a much higher rate than a high-friction request like a product demo or a consultation.
Moving deeper into the funnel, MQL-to-SQL conversion rates have become a primary KPI for marketing-sales alignment. Recent datasets show a median conversion rate of approximately 13% to 13.7%. However, high-performing teams with strict qualification models are reporting rates as high as 28.4%. This disparity suggests that the quality of the lead source and the efficacy of lead scoring systems are more critical than the sheer volume of leads generated. Furthermore, the conversion from SQL to Opportunity typically serves as a litmus test for sales discovery efficiency, while the Opportunity-to-Customer (win rate) metric reflects the ultimate alignment of product-market fit, pricing, and sales execution.
The Cost Per Lead (CPL) Paradigm
The debate over what constitutes a "good" CPL continues to dominate marketing strategy sessions. In 2026, the industry has moved toward a more holistic view that balances acquisition costs against the total revenue potential of the lead. The formula for CPL—campaign spend divided by leads generated—is increasingly being replaced or supplemented by Cost Per Opportunity (CPO) and Customer Acquisition Cost (CAC).
Market observations reveal that focusing solely on minimizing CPL often leads to "cheap lead traps," where low-cost leads fail to convert into meaningful revenue. A $75 lead from a broad social media campaign may seem attractive, but if only 1% of those leads reach the opportunity stage, the effective cost of that opportunity is $7,500. In contrast, a $300 lead from a high-intent industry directory or a targeted PPC campaign that converts to an opportunity at a 10% rate results in a $3,000 cost per opportunity. Consequently, 2026 marketing strategies are prioritizing "profitable pipeline" over "volume-based acquisition."
Channel-Specific Performance and Buyer Intent
Performance benchmarks vary significantly by channel, reflecting the different levels of intent inherent in each medium. Industry directories and specialized platforms have emerged as top performers in 2026, as they capture buyers who are already in the "evaluation" phase of their journey. Referral traffic and organic search (SEO) continue to produce leads with the highest close rates, although the volume can be harder to scale quickly compared to paid channels.
LinkedIn Ads and Google Ads remain staples of the B2B mix, but their benchmarks are evaluated differently. Google Ads is typically benchmarked against immediate conversion and CPL due to the high-intent nature of search queries. LinkedIn, however, is often measured by its ability to reach a precise ICP, with benchmarks focusing on assisted pipeline and long-term brand recognition. Meanwhile, webinars and content marketing are increasingly viewed through the lens of lead nurturing, where the primary goal is to move existing leads from the "awareness" stage to the "consideration" stage.
The Influence of ACV and Sales Models
A company’s Annual Contract Value (ACV) and go-to-market model are perhaps the most significant determinants of what "good" benchmarks look like. Product-Led Growth (PLG) models, which rely on high volumes of low-cost signups, focus heavily on the "Time to Value" and "Trial-to-Paid" conversion rates. For these businesses, a low CPL is essential for maintaining margins.
On the other end of the spectrum, Enterprise sales models dealing with six- or seven-figure contracts operate under entirely different parameters. In these environments, the sales cycle can extend from six to eighteen months, and the buying committee may involve a dozen stakeholders. Benchmarks here focus on "Account-Based" metrics, such as the number of engaged contacts within a target account and the velocity of the deal through various stages of the procurement process. For an enterprise firm, spending several thousand dollars to acquire a single qualified opportunity is often considered a high-performing investment.
Diagnosing Funnel Leaks and Underperformance
Benchmarking allows organizations to perform forensic analysis on their sales funnels. When a funnel underperforms, the location of the "leak" usually points to a specific strategic or tactical failure:
- High Traffic, Low Leads: Suggests a disconnect between the audience being attracted and the value proposition offered on the landing page.
- High Lead Volume, Low MQLs: Indicates poor targeting in advertising or content that attracts individuals who do not fit the buyer persona.
- High MQL Volume, Low SQLs: Points to a qualification mismatch or a disagreement between marketing and sales on what constitutes a "ready" buyer.
- High SQL Volume, Low Opportunities: Often signals issues in the sales discovery process or a lack of urgency in the prospect’s current business environment.
- High Opportunity Volume, Low Wins: Suggests problems with pricing, product features, or competitive positioning.
The AI Search Era and the Future of Measurement
As we move through 2026, the rise of AI-driven search engines and Large Language Model (LLM) interfaces like ChatGPT and Perplexity has introduced new complexities to lead generation. Buyers are increasingly conducting their initial research within AI environments, meaning they may be well-informed before they ever visit a vendor’s website. This "dark funnel" activity makes traditional attribution more difficult.
In response, forward-thinking B2B organizations are complementing traditional form-fill benchmarks with "signal-based" metrics. These include brand mentions within AI-generated responses, share of voice in industry-specific LLM datasets, and intent signals from third-party providers. While "AI lead generation benchmarks" are still in their infancy, the industry is moving toward a model where brand authority and "unmeasured" influence play a larger role in the eventual conversion of a lead.
Conclusion and Strategic Implications
The ultimate takeaway for B2B marketers in 2026 is that industry benchmarks should serve as a compass, not a GPS. While knowing that the median MQL-to-SQL conversion rate is 13% is useful for baseline calibration, the most valuable benchmarks are internal and historical. By tracking how their specific audience moves through their unique sales process over time, organizations can identify genuine improvements and set realistic, achievable goals.
Successful lead generation in 2026 requires a shift in focus from the "lowest CPL" to the "most sustainable pipeline." This involves a sophisticated understanding of buyer intent, a commitment to marketing-sales alignment, and the agility to adapt to new technologies like AI search. As the cost of attention continues to rise, the companies that thrive will be those that use data not just to report on the past, but to predict and optimize the future of their revenue engine. High-performing teams will continue to prioritize lead quality and downstream revenue impact over top-of-funnel volume, ensuring that every marketing dollar spent is an investment in long-term, scalable growth.