The landscape of B2B marketing has transitioned into an era where data-driven precision is no longer an advantage but a fundamental requirement for survival. As organizations look toward the fiscal realities of 2026, the reliance on gut feeling has been replaced by a rigorous adherence to performance benchmarks. According to recent industry data from HubSpot, approximately 79% of marketing professionals now concede that their organizations must become significantly more data-driven to remain competitive in a crowded digital marketplace. This shift is driven by the increasing need to justify marketing spend, demonstrate clear contributions to revenue, and optimize the complex journey from an anonymous visitor to a loyal enterprise customer.
In the current B2B environment, metrics such as a $150 cost per lead (CPL) or a 15% Marketing Qualified Lead (MQL) to Sales Qualified Lead (SQL) conversion rate are frequently cited, yet they remain hollow without the necessary context. Benchmarking in 2026 requires a nuanced understanding of channel intent, buyer personas, and the specific go-to-market models employed by a firm. A high-intent demo request from an enterprise decision-maker cannot be measured against the same yardstick as an eBook download from a junior researcher. Consequently, marketing teams are moving away from rigid, universal targets toward a more sophisticated framework of reference points that account for the nuances of the modern sales cycle.
The Evolution of the B2B Lead Generation Funnel
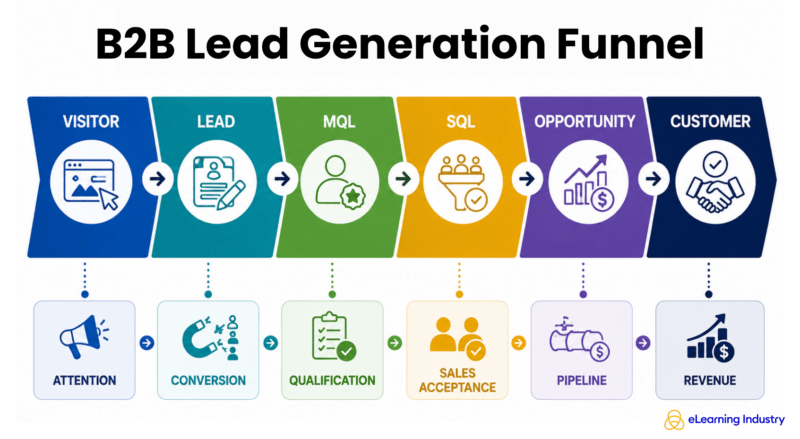
To accurately measure performance, organizations must first establish a standardized definition of their funnel stages. The traditional progression—Visitor to Lead, Lead to MQL, MQL to SQL, SQL to Opportunity, and Opportunity to Customer—remains the backbone of B2B measurement, but the criteria for each stage have become more stringent.
In 2026, the "Lead to MQL" stage is often where the greatest discrepancy occurs between organizations. For instance, a company that defines every content download as an MQL will naturally report higher volume but significantly lower conversion rates further down the funnel. Conversely, a company that requires firmographic fit, behavioral triggers (such as visiting a pricing page), and specific job titles to qualify an MQL will report lower volumes but a much healthier MQL-to-SQL conversion rate. Industry analysts note that the median MQL-to-SQL conversion rate currently hovers around 13%, though top-quartile performers—those with highly aligned sales and marketing teams—often see rates exceeding 28%.
Visitor-to-Lead Conversion and the Impact of Intent
The first stage of the funnel, converting website traffic into identifiable leads, is heavily influenced by the type of offer presented. Research suggests that B2B website conversion rates typically fall between 1% and 5%. However, this range is deceptive when analyzed in isolation.
High-intent offers, such as demo requests, trial sign-ups, or "Contact Sales" forms, often see lower conversion rates (often sub-1%) but yield leads with a much higher probability of closing. Low-intent offers, including white papers, checklists, and webinar registrations, can achieve conversion rates of 5% to 10% or higher. The challenge for 2026 marketers is balancing these two ends of the spectrum. Over-indexing on low-intent leads can inflate top-of-funnel metrics while creating a "bottleneck of noise" for sales teams, whereas focusing solely on high-intent leads may result in an insufficient pipeline volume to meet aggressive growth targets.
The Cost Per Lead (CPL) Paradox
One of the most scrutinized metrics in B2B marketing is the Cost Per Lead. While it is a simple calculation—campaign spend divided by leads generated—it is frequently misused as a primary indicator of campaign success. In 2026, the industry has recognized the "CPL Paradox": a cheaper lead is often more expensive in the long run.
Consider a scenario where Campaign A generates leads at $50 each through broad social media targeting, but only 2% of those leads eventually become customers. Campaign B generates leads at $300 each through highly targeted industry directories and search intent, but 15% of those leads convert to revenue. Despite the six-fold increase in initial cost, Campaign B represents a more efficient use of capital. Effective benchmarking now requires evaluating CPL alongside Customer Acquisition Cost (CAC) and the total Lifetime Value (LTV) of the acquired client. In sectors like enterprise software, where annual contract values (ACV) can exceed $100,000, a CPL of $500 or even $1,000 is often considered excellent performance.
Benchmarking by Channel: Search, Social, and Beyond
Not all channels are created equal, and their benchmarks reflect the varying degrees of buyer intent.
- Search Engine Optimization (SEO): Often produces the highest quality leads due to the inbound nature of the traffic. While the "cost" is often hidden in long-term content production and technical maintenance, the conversion from SQL to Opportunity tends to be higher because the buyer is actively seeking a solution.
- Paid Search (PPC): This remains a high-intent channel. Benchmarks here focus on "Cost per Opportunity" rather than just CPL. In 2026, with the rise of AI-integrated search, PPC strategies have shifted toward capturing specific "problem-state" queries.
- LinkedIn and Social Advertising: These channels are prized for their firmographic targeting. Benchmarks here often focus on Ideal Customer Profile (ICP) fit. A successful LinkedIn campaign in 2026 is measured by the percentage of leads that match the "target account list" rather than raw volume.
- Industry Directories and Niche Platforms: Specialized platforms have become critical for reaching buyers in the evaluation stage. Because these users are often comparing vendors, the referral-to-lead conversion rates are typically higher than general web traffic.
The Rise of the AI Search Era
A significant shift in the 2026 benchmarking landscape is the impact of Artificial Intelligence on the buyer journey. Buyers now utilize AI tools like ChatGPT, Perplexity, and Google’s Search Generative Experience to conduct deep research before ever visiting a vendor’s website. This "dark funnel" activity means that by the time a lead is captured, they are often much further along in the decision-making process than in previous years.
Marketing teams are responding by tracking "un-gated" metrics. This includes share of voice in AI responses, brand mentions in community forums, and the consumption of "zero-click" content. While these are harder to benchmark against traditional conversion funnels, they are essential precursors to the measurable leads that eventually appear in the CRM.
Strategic Variations: ACV and GTM Models
Benchmarking must also be adjusted for the organization’s specific Go-To-Market (GTM) model.
- Product-Led Growth (PLG): For companies with low-ACV, self-service products, the focus is on "Product Qualified Leads" (PQLs) and the velocity of the trial-to-paid conversion. High volume and low CPL are the primary drivers here.
- Enterprise Sales: For high-ACV, complex sales, the benchmarks shift toward "Pipeline Velocity" and "Account Penetration." In these models, the sales cycle can span 6 to 18 months, making the "Opportunity to Customer" win rate a more critical metric than the initial click-through rate.
Diagnosing Funnel Inefficiencies
When internal numbers fall below industry benchmarks, it serves as a diagnostic tool for identifying specific organizational weaknesses.
- High Traffic, Low Leads: Suggests a mismatch between the audience and the offer, or a technical failure in the website’s user experience.
- High MQL Volume, Low SQL Conversion: Indicates a lack of alignment between marketing’s qualification criteria and sales’ expectations.
- High SQL Volume, Low Wins: Points toward issues in product-market fit, pricing strategy, or the effectiveness of the sales closing process.
Conclusion: Moving Toward Internal Benchmarking
While industry averages provide a useful "weather vane" for market conditions, the most successful B2B organizations in 2026 are those that prioritize internal historical benchmarks. By tracking year-over-year improvements in their specific funnel, companies can account for their unique brand equity, market maturity, and product complexity.
The ultimate goal of B2B lead generation measurement is to move beyond the isolation of marketing metrics and connect every activity to sustainable revenue growth. As the digital ecosystem becomes more fragmented and AI-driven, the ability to interpret these benchmarks with sophistication will distinguish the market leaders from those merely chasing volume. Organizations are encouraged to review their performance data quarterly, adjusting their targets to reflect changes in buyer behavior and economic shifts, ensuring that their marketing spend is always an investment in high-quality, convertible pipeline.